#elasticsearch cluster
Explore tagged Tumblr posts
Visit Tumblr Blog
Explore Tumblr blogs with no restrictions, modern design and the best experience.
Last Seen Tumblr Blogs


Fun Fact
BuzzFeed published a report claiming that Tumblr was utilized as a distribution channel for Russian agents to influence American voting habits during the 2016 presidential election in Feb 2018.
Text
🚀 Exploring Kafka: Scenario-Based Questions 📊
Dear community, As Kafka continues to shape modern data architectures, it's crucial for professionals to delve into scenario-based questions to deepen their understanding and application. Whether you're a seasoned Kafka developer or just starting out, here are some key scenarios to ponder: 1️⃣ **Scaling Challenges**: How would you design a Kafka cluster to handle a sudden surge in incoming data without compromising latency? 2️⃣ **Fault Tolerance**: Describe the steps you would take to ensure high availability in a Kafka setup, considering both hardware and software failures. 3️⃣ **Performance Tuning**: What metrics would you monitor to optimize Kafka producer and consumer performance in a high-throughput environment? 4️⃣ **Security Measures**: How do you secure Kafka clusters against unauthorized access and data breaches? What are some best practices? 5️⃣ **Integration with Ecosystem**: Discuss a real-world scenario where Kafka is integrated with other technologies like Spark, Hadoop, or Elasticsearch. What challenges did you face and how did you overcome them? Follow : https://algo2ace.com/kafka-stream-scenario-based-interview-questions/
#Kafka #BigData #DataEngineering #TechQuestions #ApacheKafka #BigData #Interview
2 notes
·
View notes
Text
How To Setup Elasticsearch 6.4 On RHEL/CentOS 6/7?
What is Elasticsearch? Elasticsearch is a search engine based on Lucene. It is useful in a distributed environment and helps in a multitenant-capable full-text search engine. While you query something from Elasticsearch it will provide you with an HTTP web interface and schema-free JSON documents. it provides the ability for full-text search. Elasticsearch is developed in Java and is released as open-source under the terms of the Apache 2 license. Scenario: 1. Server IP: 192.168.56.101 2. Elasticsearch: Version 6.4 3. OS: CentOS 7.5 4. RAM: 4 GB Note: If you are a SUDO user then prefix every command with sudo, like #sudo ifconfig With the help of this guide, you will be able to set up Elasticsearch single-node clusters on CentOS, Red Hat, and Fedora systems. Step 1: Install and Verify Java Java is the primary requirement for installing Elasticsearch. So, make sure you have Java installed on your system. # java -version openjdk version "1.8.0_181" OpenJDK Runtime Environment (build 1.8.0_181-b13) OpenJDK 64-Bit Server VM (build 25.181-b13, mixed mode) If you don’t have Java installed on your system, then run the below command # yum install java-1.8.0-openjdk Step 2: Setup Elasticsearch For this guide, I am downloading the latest Elasticsearch tar from its official website so follow the below step # wget https://artifacts.elastic.co/downloads/elasticsearch/elasticsearch-6.4.2.tar.gz # tar -xzf elasticsearch-6.4.2.tar.gz # tar -xzf elasticsearch-6.4.2.tar.gz # mv elasticsearch-6.4.2 /usr/local/elasticsearch Step 5: Permission and User We need a user for running elasticsearch (root is not recommended). # useradd elasticsearch # chown -R elasticsearch.elasticsearch /usr/local/elasticsearch/ Step 6: Setup Ulimits Now to get a Running system we need to make some changes of ulimits else we will get an error like “max number of threads for user is too low, increase to at least ” so to overcome this issue make below changes you should run. # ulimit -n 65536 # ulimit -u 2048 Or you may edit the file to make changes permanent # vim /etc/security/limits.conf elasticsearch - nofile 65536 elasticsearch soft nofile 64000 elasticsearch hard nofile 64000 elasticsearch hard nproc 4096 elasticsearch soft nproc 4096 Save files using :wq Step 7: Configure Elasticsearch Now make some configuration changes like cluster name or node name to make our single node cluster live. # cd /usr/local/elasticsearch/ Now, look for the below keywords in the file and change according to you need # vim conf/elasticsearch.yml cluster.name: kapendra-cluster-1 node.name: kapendra-node-1 http.port: 9200 to set this value to your IP or make it 0.0.0.0 ID needs to be accessible from anywhere from the network. Else put your IP of localhost network.host: 0.0.0.0 There is one more thing if you have any dedicated mount pint for data then change the value for #path.data: /path/to/data to your mount point.
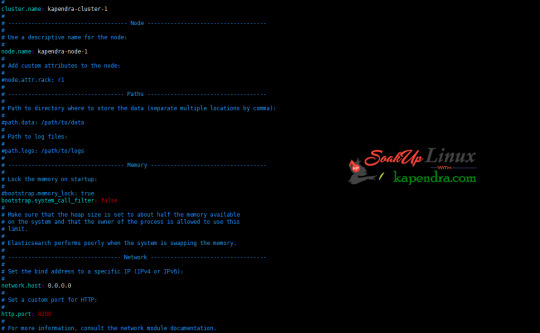
Your configuration should look like the above. Step 8: Starting Elasticsearch Cluster As the Elasticsearch setup is completed. Let the start Elasticsearch cluster with elastic search user so first switch to elastic search user and then run the cluster # su - elasticsearch $ /usr/local/elasticsearch/bin/elasticsearch 22278 Step 9: Verify Setup You have all done it, just need to verify the setup. Elasticsearch works on port default port 9200, open your browser to point your server on port 9200, You will find something like the below output http://localhost:9200 or http://192.168.56.101:9200 at the end of this article, you have successfully set up Elasticsearch single node cluster. In the next few articles, we will try to cover a few commands and their setup in the docker container for development environments on local machines. Read the full article
2 notes
·
View notes
Text
What is Solr – Comparing Apache Solr vs. Elasticsearch
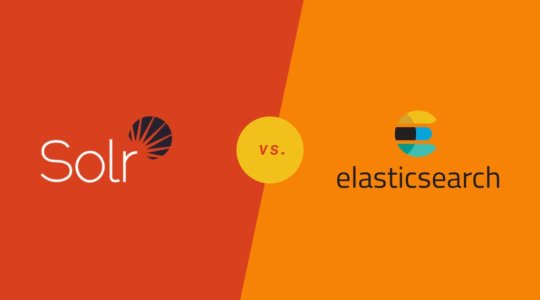
In the world of search engines and data retrieval systems, Apache Solr and Elasticsearch are two prominent contenders, each with its strengths and unique capabilities. These open-source, distributed search platforms play a crucial role in empowering organizations to harness the power of big data and deliver relevant search results efficiently. In this blog, we will delve into the fundamentals of Solr and Elasticsearch, highlighting their key features and comparing their functionalities. Whether you're a developer, data analyst, or IT professional, understanding the differences between Solr and Elasticsearch will help you make informed decisions to meet your specific search and data management needs.
Overview of Apache Solr
Apache Solr is a search platform built on top of the Apache Lucene library, known for its robust indexing and full-text search capabilities. It is written in Java and designed to handle large-scale search and data retrieval tasks. Solr follows a RESTful API approach, making it easy to integrate with different programming languages and frameworks. It offers a rich set of features, including faceted search, hit highlighting, spell checking, and geospatial search, making it a versatile solution for various use cases.
Overview of Elasticsearch
Elasticsearch, also based on Apache Lucene, is a distributed search engine that stands out for its real-time data indexing and analytics capabilities. It is known for its scalability and speed, making it an ideal choice for applications that require near-instantaneous search results. Elasticsearch provides a simple RESTful API, enabling developers to perform complex searches effortlessly. Moreover, it offers support for data visualization through its integration with Kibana, making it a popular choice for log analysis, application monitoring, and other data-driven use cases.
Comparing Solr and Elasticsearch
Data Handling and Indexing
Both Solr and Elasticsearch are proficient at handling large volumes of data and offer excellent indexing capabilities. Solr uses XML and JSON formats for data indexing, while Elasticsearch relies on JSON, which is generally considered more human-readable and easier to work with. Elasticsearch's dynamic mapping feature allows it to automatically infer data types during indexing, streamlining the process further.
Querying and Searching
Both platforms support complex search queries, but Elasticsearch is often regarded as more developer-friendly due to its clean and straightforward API. Elasticsearch's support for nested queries and aggregations simplifies the process of retrieving and analyzing data. On the other hand, Solr provides a range of query parsers, allowing developers to choose between traditional and advanced syntax options based on their preference and familiarity.
Scalability and Performance
Elasticsearch is designed with scalability in mind from the ground up, making it relatively easier to scale horizontally by adding more nodes to the cluster. It excels in real-time search and analytics scenarios, making it a top choice for applications with dynamic data streams. Solr, while also scalable, may require more effort for horizontal scaling compared to Elasticsearch.
Community and Ecosystem
Both Solr and Elasticsearch boast active and vibrant open-source communities. Solr has been around longer and, therefore, has a more extensive user base and established ecosystem. Elasticsearch, however, has gained significant momentum over the years, supported by the Elastic Stack, which includes Kibana for data visualization and Beats for data shipping.
Document-Based vs. Schema-Free
Solr follows a document-based approach, where data is organized into fields and requires a predefined schema. While this provides better control over data, it may become restrictive when dealing with dynamic or constantly evolving data structures. Elasticsearch, being schema-free, allows for more flexible data handling, making it more suitable for projects with varying data structures.
Conclusion
In summary, Apache Solr and Elasticsearch are both powerful search platforms, each excelling in specific scenarios. Solr's robustness and established ecosystem make it a reliable choice for traditional search applications, while Elasticsearch's real-time capabilities and seamless integration with the Elastic Stack are perfect for modern data-driven projects. Choosing between the two depends on your specific requirements, data complexity, and preferred development style. Regardless of your decision, both Solr and Elasticsearch can supercharge your search and analytics endeavors, bringing efficiency and relevance to your data retrieval processes.
Whether you opt for Solr, Elasticsearch, or a combination of both, the future of search and data exploration remains bright, with technology continually evolving to meet the needs of next-generation applications.
2 notes
·
View notes
Text
Where Can I Find DevOps Training with Placement Near Me?
Introduction: Unlock Your Tech Career with DevOps Training
In today’s digital world, companies are moving faster than ever. Continuous delivery, automation, and rapid deployment have become the new norm. That’s where DevOps comes in a powerful blend of development and operations that fuels speed and reliability in software delivery.
Have you ever wondered how companies like Amazon, Netflix, or Facebook release features so quickly without downtime? The secret lies in DevOps an industry-demanded approach that integrates development and operations to streamline software delivery. Today, DevOps skills are not just desirable they’re essential. If you’re asking, “Where can I find DevOps training with placement near me?”, this guide will walk you through everything you need to know to find the right training and land the job you deserve.

Understanding DevOps: Why It Matters
DevOps is more than a buzzword it’s a cultural and technical shift that transforms how software teams build, test, and deploy applications. It focuses on collaboration, automation, continuous integration (CI), continuous delivery (CD), and feedback loops.
Professionals trained in DevOps can expect roles like:
DevOps Engineer
Site Reliability Engineer
Cloud Infrastructure Engineer
Release Manager
The growing reliance on cloud services and rapid deployment pipelines has placed DevOps engineers in high demand. A recent report by Global Knowledge ranks DevOps as one of the highest-paying tech roles in North America.
Why DevOps Training with Placement Is Crucial
Many learners begin with self-study or unstructured tutorials, but that only scratches the surface. A comprehensive DevOps training and placement program ensures:
Structured learning of core and advanced DevOps concepts
Hands-on experience with DevOps automation tools
Resume building, interview preparation, and career support
Real-world project exposure to simulate a professional environment
Direct pathways to job interviews and job offers
If you’re looking for DevOps training with placement “near me,” remember that “location” today is no longer just geographic—it’s also digital. The right DevOps online training can provide the accessibility and support you need, no matter your zip code.
Core Components of a DevOps Course Online
When choosing a DevOps course online, ensure it covers the following modules in-depth:
1. Introduction to DevOps Culture and Principles
Evolution of DevOps
Agile and Lean practices
Collaboration and communication strategies
2. Version Control with Git and GitHub
Branching and merging strategies
Pull requests and code reviews
Git workflows in real-world projects
3. Continuous Integration (CI) Tools
Jenkins setup and pipelines
GitHub Actions
Code quality checks and automated builds
4. Configuration Management
Tools like Ansible, Chef, or Puppet
Managing infrastructure as code (IaC)
Role-based access control
5. Containerization and Orchestration
Docker fundamentals
Kubernetes (K8s) clusters, deployments, and services
Helm charts and autoscaling strategies
6. Monitoring and Logging
Prometheus and Grafana
ELK Stack (Elasticsearch, Logstash, Kibana)
Incident alerting systems
7. Cloud Infrastructure and DevOps Automation Tools
AWS, Azure, or GCP fundamentals
Terraform for IaC
CI/CD pipelines integrated with cloud services
Real-World Applications: Why Hands-On Learning Matters
A key feature of any top-tier DevOps training online is its practical approach. Without hands-on labs or real projects, theory can only take you so far.
Here’s an example project structure:
Project: Deploying a Multi-Tier Application with Kubernetes
Such projects help learners not only understand tools but also simulate real DevOps scenarios, building confidence and clarity.
DevOps Training and Certification: What You Should Know
Certifications validate your knowledge and can significantly improve your job prospects. A solid DevOps training and certification program should prepare you for globally recognized exams like:
DevOps Foundation Certification
Certified Kubernetes Administrator (CKA)
AWS Certified DevOps Engineer
Docker Certified Associate
While certifications are valuable, employers prioritize candidates who demonstrate both theoretical knowledge and applied skills. This is why combining training with placement offers the best return on investment.
What to Look for in a DevOps Online Course
If you’re on the hunt for the best DevOps training online, here are key features to consider:
Structured Curriculum
It should cover everything from fundamentals to advanced automation practices.
Expert Trainers
Trainers should have real industry experience, not just academic knowledge.
Hands-On Projects
Project-based assessments help bridge the gap between theory and application.
Flexible Learning
A good DevOps online course offers recordings, live sessions, and self-paced materials.
Placement Support
Look for programs that offer:
Resume writing and LinkedIn profile optimization
Mock interviews with real-time feedback
Access to a network of hiring partners
Benefits of Enrolling in DevOps Bootcamp Online
A DevOps bootcamp online fast-tracks your learning process. These are intensive, short-duration programs designed for focused outcomes. Key benefits include:
Rapid skill acquisition
Industry-aligned curriculum
Peer collaboration and group projects
Career coaching and mock interviews
Job referrals and hiring events
Such bootcamps are ideal for professionals looking to upskill, switch careers, or secure a DevOps role without spending years in academia.
DevOps Automation Tools You Must Learn
Git & GitHub Git is the backbone of version control in DevOps, allowing teams to track changes, collaborate on code, and manage development history. GitHub enhances this by offering cloud-based repositories, pull requests, and code review tools—making it a must-know for every DevOps professional.
Jenkins Jenkins is the most popular open-source automation server used to build and manage continuous integration and continuous delivery (CI/CD) pipelines. It integrates with almost every DevOps tool and helps automate testing, deployment, and release cycles efficiently.
Docker Docker is a game-changer in DevOps. It enables you to containerize applications, ensuring consistency across environments. With Docker, developers can package software with all its dependencies, leading to faster development and more reliable deployments.
Kubernetes Once applications are containerized, Kubernetes helps manage and orchestrate them at scale. It automates deployment, scaling, and load balancing of containerized applications—making it essential for managing modern cloud-native infrastructures.
Ansible Ansible simplifies configuration management and infrastructure automation. Its agentless architecture and easy-to-write YAML playbooks allow you to automate repetitive tasks across servers and maintain consistency in deployments.
Terraform Terraform enables Infrastructure as Code (IaC), allowing teams to provision and manage cloud resources using simple, declarative code. It supports multi-cloud environments and ensures consistent infrastructure with minimal manual effort.
Prometheus & Grafana For monitoring and alerting, Prometheus collects metrics in real-time, while Grafana visualizes them beautifully. Together, they help track application performance and system health essential for proactive operations.
ELK Stack (Elasticsearch, Logstash, Kibana) The ELK stack is widely used for centralized logging. Elasticsearch stores logs, Logstash processes them, and Kibana provides powerful visualizations, helping teams troubleshoot issues quickly.
Mastering these tools gives you a competitive edge in the DevOps job market and empowers you to build reliable, scalable, and efficient software systems.
Job Market Outlook for DevOps Professionals
According to the U.S. Bureau of Labor Statistics, software development roles are expected to grow 25% by 2032—faster than most other industries. DevOps roles are a large part of this trend. Companies need professionals who can automate pipelines, manage scalable systems, and deliver software efficiently.
Average salaries in the U.S. for DevOps engineers range between $95,000 to $145,000, depending on experience, certifications, and location.
Companies across industries—from banking and healthcare to retail and tech—are hiring DevOps professionals for critical digital transformation roles.
Is DevOps for You?
If you relate to any of the following, a DevOps course online might be the perfect next step:
You're from an IT background looking to transition into automation roles
You enjoy scripting, problem-solving, and system management
You're a software developer interested in faster and reliable deployments
You're a system admin looking to expand into cloud and DevOps roles
You want a structured, placement-supported training program to start your career
How to Get Started with DevOps Training and Placement
Step 1: Enroll in a Comprehensive Program
Choose a program that covers both foundational and advanced concepts and includes real-time projects.
Step 2: Master the Tools
Practice using popular DevOps automation tools like Docker, Jenkins, and Kubernetes.
Step 3: Work on Live Projects
Gain experience working on CI/CD pipelines, cloud deployment, and infrastructure management.
Step 4: Prepare for Interviews
Use mock sessions, Q&A banks, and technical case studies to strengthen your readiness.
Step 5: Land the Job
Leverage placement services, interview support, and resume assistance to get hired.
Key Takeaways
DevOps training provides the automation and deployment skills demanded in modern software environments.
Placement support is crucial to transitioning from learning to earning.
Look for comprehensive online courses that offer hands-on experience and job assistance.
DevOps is not just a skill it’s a mindset of collaboration, speed, and innovation.
Ready to launch your DevOps career? Join H2K Infosys today for hands-on learning and job placement support. Start your transformation into a DevOps professional now.
#devops training#DevOps course#devops training online#devops online training#devops training and certification#devops certification training#devops training with placement#devops online courses#best devops training online#online DevOps course#advanced devops course#devops training and placement#devops course online#devops real time training#DevOps automation tools
0 notes
Text
Enhance Commerce and Search with Magento Modules and Elasticsearch in Python
In the digital commerce space, two pillars define performance: platform flexibility and data accessibility. Magento, with its modular architecture, offers the flexibility to build custom commerce experiences. On the other hand, Elasticsearch, when used with Python, provides blazing-fast, scalable search and analytics capabilities across vast datasets.
At Bluethink Inc, we specialize in developing Magento custom modules and building advanced search systems using the Elasticsearch Python client. Together, these technologies allow businesses to build smarter, faster, and more personalized digital experiences.
Custom Magento Modules: Beyond Out-of-the-Box
Magento 2 is a powerful open-source eCommerce platform built for customization. While its out-of-the-box capabilities cover most standard features, every business is unique. That’s where custom module development comes into play.
What Is a Magento Custom Module?
A custom module in Magento 2 is a standalone package that adds or modifies functionality without changing the core code. It follows Magento’s architecture principles, allowing developers to extend admin features, frontend behavior, and system logic.
What Can You Do with a Custom Module?
With Magento custom modules, you can:
Automate order processing logic
Add new payment or shipping options
Build integrations with external APIs
Customize product attribute behavior
Create admin panel enhancements for staff efficiency
Enable user-specific promotions or loyalty programs
Our team at Bluethink Inc has implemented modules that support everything from custom reporting tools to complex checkout experiences integrated with third-party tools.
Elasticsearch with Python: Unlocking Fast, Smart Search
Elasticsearch is a distributed search and analytics engine, commonly used for log analysis, product search, and business intelligence. When paired with Python, it becomes even more powerful—allowing developers to build intelligent search features and dashboards using minimal code.
The Elasticsearch Python client (elasticsearch-py) is the official low-level client for interacting with Elasticsearch clusters. It is built for reliability, speed, and compatibility with Elasticsearch's RESTful API.
Why Use Elasticsearch with Python?
Real-time indexing and querying of large datasets
Advanced full-text search with scoring and ranking
Support for aggregations, filters, and facets
Seamless integration with Django, Flask, or standalone Python apps
Custom scripts and ML-driven search ranking via Python
We use Elasticsearch in a wide variety of scenarios—from creating intelligent product recommendations to processing behavioral data and powering admin search dashboards.
Combined Use Case: Magento + Elasticsearch Search Intelligence
Client Challenge: A fashion retailer wanted to enhance product discovery and improve backend reporting. Magento’s default search lacked flexibility, and the admin reporting tools were too limited.
Bluethink Solution:
Built a custom Magento module to track real-time search queries and purchasing behavior.
Developed a Python microservice using the Elasticsearch client to process, index, and serve data from Magento in real time.
Added advanced search filters, auto-complete, and relevancy tuning for frontend users.
Created a dashboard that allowed business users to view high-performing search queries and low-converting results.
Outcome:
40% increase in product search engagement
25% improvement in conversion rates from internal search
Actionable insights for merchandising and marketing teams
Why Bluethink Inc?
At Bluethink, we bring together deep platform knowledge with robust data engineering experience. Whether you're extending Magento’s capabilities or building a fast search engine with Python and Elasticsearch, we offer full-spectrum expertise.
What Sets Us Apart:
Magento 2 Certified Developers
Experienced Python and Elasticsearch engineers
API-first development approach
End-to-end delivery from planning to deployment
Performance optimization and long-term support
From custom checkout flows to intelligent search engines, we build tools that help your business scale efficiently.
Our Development Process
Discovery & Planning Understand your business model, pain points, and integration requirements.
Architecture & Design Plan modular, scalable solutions tailored to your systems.
Custom Module or API Development Build clean, upgrade-safe Magento modules or high-performance Python apps.
Testing & Optimization Validate functionality, stress-test search performance, and ensure data integrity.
Deployment & Support Go live with confidence, backed by post-launch monitoring and support.
Final Thoughts
Today’s eCommerce businesses need more than static platforms. They need flexible infrastructure that adapts to customer behavior and business change. By combining custom Magento module development with Elasticsearch search intelligence in Python, you can unlock transformative capabilities across your entire digital operation.
At Bluethink Inc, we don’t just implement features—we help architect the systems that power next-generation commerce.
Build Your Smarter Commerce Engine Today
Talk to Bluethink Inc to explore how Magento custom modules and Elasticsearch-powered Python applications can take your digital business to the next level.
0 notes
Text
Creating and Configuring Production ROSA Clusters (CS220) – A Practical Guide
Introduction
Red Hat OpenShift Service on AWS (ROSA) is a powerful managed Kubernetes solution that blends the scalability of AWS with the developer-centric features of OpenShift. Whether you're modernizing applications or building cloud-native architectures, ROSA provides a production-grade container platform with integrated support from Red Hat and AWS. In this blog post, we’ll walk through the essential steps covered in CS220: Creating and Configuring Production ROSA Clusters, an instructor-led course designed for DevOps professionals and cloud architects.
What is CS220?
CS220 is a hands-on, lab-driven course developed by Red Hat that teaches IT teams how to deploy, configure, and manage ROSA clusters in a production environment. It is tailored for organizations that are serious about leveraging OpenShift at scale with the operational convenience of a fully managed service.
Why ROSA for Production?
Deploying OpenShift through ROSA offers multiple benefits:
Streamlined Deployment: Fully managed clusters provisioned in minutes.
Integrated Security: AWS IAM, STS, and OpenShift RBAC policies combined.
Scalability: Elastic and cost-efficient scaling with built-in monitoring and logging.
Support: Joint support model between AWS and Red Hat.
Key Concepts Covered in CS220
Here’s a breakdown of the main learning outcomes from the CS220 course:
1. Provisioning ROSA Clusters
Participants learn how to:
Set up required AWS permissions and networking pre-requisites.
Deploy clusters using Red Hat OpenShift Cluster Manager (OCM) or CLI tools like rosa and oc.
Use STS (Short-Term Credentials) for secure cluster access.
2. Configuring Identity Providers
Learn how to integrate Identity Providers (IdPs) such as:
GitHub, Google, LDAP, or corporate IdPs using OpenID Connect.
Configure secure, role-based access control (RBAC) for teams.
3. Networking and Security Best Practices
Implement private clusters with public or private load balancers.
Enable end-to-end encryption for APIs and services.
Use Security Context Constraints (SCCs) and network policies for workload isolation.
4. Storage and Data Management
Configure dynamic storage provisioning with AWS EBS, EFS, or external CSI drivers.
Learn persistent volume (PV) and persistent volume claim (PVC) lifecycle management.
5. Cluster Monitoring and Logging
Integrate OpenShift Monitoring Stack for health and performance insights.
Forward logs to��Amazon CloudWatch, ElasticSearch, or third-party SIEM tools.
6. Cluster Scaling and Updates
Set up autoscaling for compute nodes.
Perform controlled updates and understand ROSA’s maintenance policies.
Use Cases for ROSA in Production
Modernizing Monoliths to Microservices
CI/CD Platform for Agile Development
Data Science and ML Workflows with OpenShift AI
Edge Computing with OpenShift on AWS Outposts
Getting Started with CS220
The CS220 course is ideal for:
DevOps Engineers
Cloud Architects
Platform Engineers
Prerequisites: Basic knowledge of OpenShift administration (recommended: DO280 or equivalent experience) and a working AWS account.
Course Format: Instructor-led (virtual or on-site), hands-on labs, and guided projects.
Final Thoughts
As more enterprises adopt hybrid and multi-cloud strategies, ROSA emerges as a strategic choice for running OpenShift on AWS with minimal operational overhead. CS220 equips your team with the right skills to confidently deploy, configure, and manage production-grade ROSA clusters — unlocking agility, security, and innovation in your cloud-native journey.
Want to Learn More or Book the CS220 Course? At HawkStack Technologies, we offer certified Red Hat training, including CS220, tailored for teams and enterprises. Contact us today to schedule a session or explore our Red Hat Learning Subscription packages. www.hawkstack.com
0 notes
Text
ElasticSearch: The Ultimate Guide to Scalable Search & Analytics
Introduction In today’s data-driven world, businesses and developers need efficient ways to store, search, and analyze large volumes of data. This is where ElasticSearch comes in — a powerful, open-source search and analytics engine built on top of Apache Lucene. ElasticSearch is widely used for full-text search, log analytics, monitoring, and real-time data visualization.
In this blog post, we will explore ElasticSearch in-depth, covering its architecture, key features, use cases, and how to get started with it.
What is ElasticSearch?
ElasticSearch is a distributed, RESTful search and analytics engine that allows users to search, analyze, and visualize data in near real-time. It was developed by Shay Banon and released in 2010. Since then, it has become a core component of the Elastic Stack (ELK Stack), which includes Logstash for data ingestion and Kibana for visualization.
Key Features Scalability: ElasticSearch scales horizontally using a distributed architecture. Full-Text Search: Provides advanced full-text search capabilities using Apache Lucene. Real-Time Indexing: Supports real-time data indexing and searching. RESTful API: Provides a powerful and flexible API for integration with various applications. Schema-Free JSON Documents: Uses a schema-free, document-oriented approach to store data in JSON format. Aggregations: Enables advanced analytics through a powerful aggregation framework. Security: Offers role-based access control (RBAC), authentication, and encryption features. Multi-Tenancy: Supports multiple indices, making it useful for handling different datasets efficiently. ElasticSearch Architecture
Understanding ElasticSearch’s architecture is essential to leveraging its full potential. Let’s break it down:
Cluster A cluster is a collection of one or more nodes working together to store and process data. Each cluster is identified by a unique name.
Node A node is a single instance of ElasticSearch that stores data and performs indexing/search operations. There are different types of nodes:
Master Node: Manages the cluster, creates/deletes indices, and handles node management. Data Node: Stores actual data and executes search/indexing operations. Ingest Node: Prepares and processes data before indexing. Coordinating Node: Routes search queries and distributes tasks to other nodes.
Index An index is a collection of documents that share similar characteristics. It is similar to a database in a relational database management system (RDBMS).
Document A document is the basic unit of data stored in ElasticSearch. It is represented in JSON format.
Shards and Replicas Shards: An index is divided into smaller pieces called shards, which allow ElasticSearch to distribute data across multiple nodes. Replicas: Each shard can have one or more replicas to ensure high availability and fault tolerance. Use Cases of ElasticSearch
ElasticSearch is widely used in various industries. Here are some key use cases:
Full-Text Search ElasticSearch’s powerful text analysis and ranking make it ideal for implementing search functionalities in websites, e-commerce platforms, and applications.
Log and Event Analytics Companies use ElasticSearch to analyze logs generated by applications, servers, and security systems. It helps in real-time monitoring, identifying errors, and optimizing system performance.
Business Intelligence & Data Visualization ElasticSearch powers data analytics dashboards like Kibana, enabling businesses to analyze trends and make data-driven decisions.
Security Information and Event Management (SIEM) Organizations use ElasticSearch for threat detection and cybersecurity monitoring by processing security logs.
IoT and Real-Time Data Processing ElasticSearch is widely used in IoT applications for processing sensor data in real-time, making it an excellent choice for IoT developers.
Continue to the Next Step by clicking here
Best Practices for Using ElasticSearch
To get the best performance from ElasticSearch, consider the following best practices:
Proper Indexing Strategy: Use optimized index mapping and data types to improve search performance. Shard Management: Avoid excessive shards and keep a balanced shard-to-node ratio. Use Bulk API for Large Data Ingestion: Instead of inserting data one by one, use the Bulk API for batch inserts. Optimize Queries: Use filters and caching to improve query performance. Enable Security Features: Implement role-based access control (RBAC) and encryption. Monitor Performance: Use Elastic Stack monitoring tools to keep track of ElasticSearch cluster health. Challenges & Limitations
Despite its advantages, ElasticSearch has some challenges:
Memory Usage: Requires careful memory tuning and management. Complex Query Syntax: Can be difficult to master for beginners. Data Consistency: ElasticSearch follows an eventual consistency model, which may not be ideal for all applications.
0 notes
Text
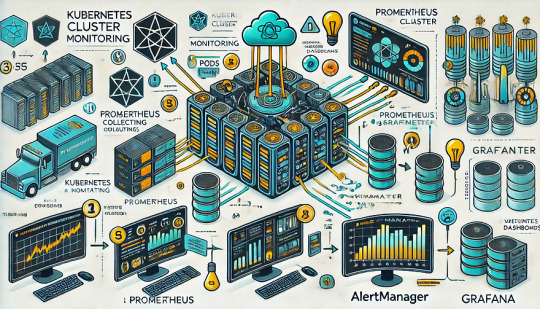
Monitoring Kubernetes Clusters with Prometheus and Grafana
Introduction
Kubernetes is a powerful container orchestration platform, but monitoring it is crucial for ensuring reliability, performance, and scalability.
Prometheus and Grafana are two of the most popular open-source tools for monitoring and visualizing Kubernetes clusters.
In this guide, we’ll walk you through setting up Prometheus and Grafana on Kubernetes and configuring dashboards for real-time insights.
Why Use Prometheus and Grafana for Kubernetes Monitoring?
Prometheus: The Monitoring Backbone
Collects metrics from Kubernetes nodes, pods, and applications.
Uses a powerful query language (PromQL) for analyzing data.
Supports alerting based on predefined conditions.
Grafana: The Visualization Tool
Provides rich dashboards with graphs and metrics.
Allows integration with multiple data sources (e.g., Prometheus, Loki, Elasticsearch).
Enables alerting and notification management.
Step 1: Installing Prometheus and Grafana on Kubernetes
Prerequisites
Before starting, ensure you have:
A running Kubernetes cluster
kubectl and Helm installed
1. Add the Prometheus Helm Chart Repository
Helm makes it easy to deploy Prometheus and Grafana using predefined configurations.shhelm repo add prometheus-community https://prometheus-community.github.io/helm-charts helm repo update
2. Install Prometheus and Grafana Using Helm
shhelm install prometheus prometheus-community/kube-prometheus-stack --namespace monitoring --create-namespace
This command installs: ✅ Prometheus — For collecting metrics ✅ Grafana — For visualization ✅ Alertmanager — For notifications ✅ Node-exporter — To collect system-level metrics
Step 2: Accessing Prometheus and Grafana
Once deployed, we need to access the Prometheus and Grafana web interfaces.
1. Accessing Prometheus
Check the Prometheus service:shkubectl get svc -n monitoring
Forward the Prometheus server port:shkubectl port-forward svc/prometheus-kube-prometheus-prometheus 9090 -n monitoring
Now, open http://localhost:9090 in your browser.
2. Accessing Grafana
Retrieve the Grafana admin password:shkubectl get secret --namespace monitoring prometheus-grafana -o jsonpath="{.data.admin-password}" | base64 --decodeForward the Grafana service port:shkubectl port-forward svc/prometheus-grafana 3000:80 -n monitoring
Open http://localhost:3000, and log in with:
Username: admin
Password: (obtained from the previous command)
Step 3: Configuring Prometheus as a Data Source in Grafana
Open Grafana and navigate to Configuration > Data Sources.
Click Add data source and select Prometheus.
Set the URL to:
sh
http://prometheus-kube-prometheus-prometheus.monitoring.svc.cluster.local:9090
Click Save & Test to verify the connection.
Step 4: Importing Kubernetes Dashboards into Grafana
Grafana provides ready-made dashboards for Kubernetes monitoring.
Go to Dashboards > Import.
Enter a dashboard ID from Grafana’s dashboard repository.
Example: Use 3119 for Kubernetes cluster monitoring.
Select Prometheus as the data source and click Import.
You’ll now have a real-time Kubernetes monitoring dashboard! 🎯
Step 5: Setting Up Alerts in Prometheus and Grafana
Creating Prometheus Alerting Rules
Create a ConfigMap for alerts:yamlapiVersion: v1 kind: ConfigMap metadata: name: alert-rules namespace: monitoring data: alert.rules: | groups: - name: InstanceDown rules: - alert: InstanceDown expr: up == 0 for: 5m labels: severity: critical annotations: summary: "Instance {{ $labels.instance }} is down"
Apply it to the cluster:shkubectl apply -f alert-rules.yaml
Configuring Grafana Alerts
Navigate to Alerting > Notification Channels.
Set up a channel (Email, Slack, or PagerDuty).
Define alert rules based on metrics from Prometheus.
Step 6: Enabling Persistent Storage for Prometheus
By default, Prometheus stores data in memory. To make the data persistent, configure storage:
Modify the Helm values:yamlprometheus: server: persistentVolume: enabled: true size: 10Gi
Apply the changes:shhelm upgrade prometheus prometheus-community/kube-prometheus-stack -f values.yaml
Conclusion
In this guide, we’ve set up Prometheus and Grafana to monitor a Kubernetes cluster. You now have: ✅ Real-time dashboards in Grafana ✅ Prometheus alerts to detect failures ✅ Persistent storage for historical metrics
WEBSITE: https://www.ficusoft.in/devops-training-in-chennai/
0 notes
Text
Creating a Custom Search Engine with Elasticsearch and React
Introduction Creating a Custom Search Engine with Elasticsearch and React is a powerful combination that allows you to build a scalable, high-performance search solution for your web application. In this tutorial, we will guide you through the process of creating a custom search engine using Elasticsearch and React. What You Will Learn How to set up an Elasticsearch cluster and index…
0 notes
Text
Is AWS Elasticsearch Developer’s True Hero?

Elasticsearch is a free open source search engine, which is used for log analytics, full-text search, application monitoring and more. It makes easy to deploy, operate and scale Elasticsearch clusters in the AWS Cloud. We can get direct access to the Elasticsearch APIs. It provides Scalability, Availability and Security for the workload process run.
Elasticsearch architecture
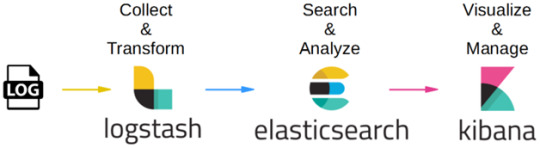
The AWS Elasticsearch Service Architecture is very dynamically to allow create instances, remove instances, change instance sizes, change storage configuration and customize to make other changes. This Elasticsearch allows to search and analyse the data log. It consists of three components.
Logstash – is used to collect and transferred to the Elasticsearch.
Elasticsearch –facilitates search and analyze with the logs stored in it. It acts as a database.
Kibana –Kibana enables the data visualization on the dashboard that uses ELK stack. This tool provides a quick insight of the documents using visualization Kibana’s dashboard contains interactive diagrams, geospatial data, and graphs to visualize complex queries that let you search, view, or interact with the stored data. Kibana helps you to perform advanced data analysis and visualize your data in a variety of tables, charts, and maps.
Get started with an Elastic Cluster with AWS
First, create an AWS account and follow the following steps to claim your domain.
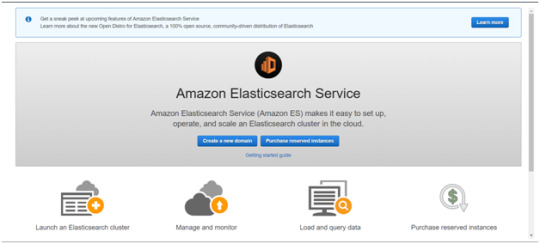
Tap on to “Create a new domain”
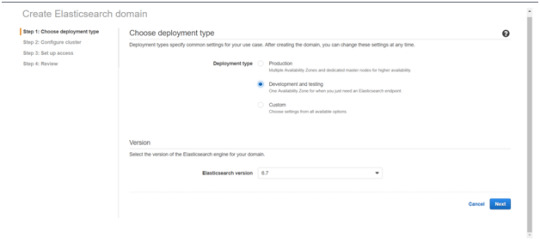
Select on the appropriated Deployment type and select the Elasticsearch version. Click Next.
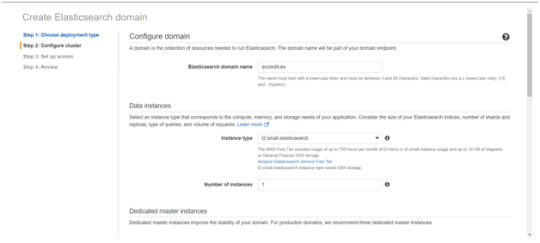
Enter a domain name and choose the Instance type in the prompt page and Click Next.
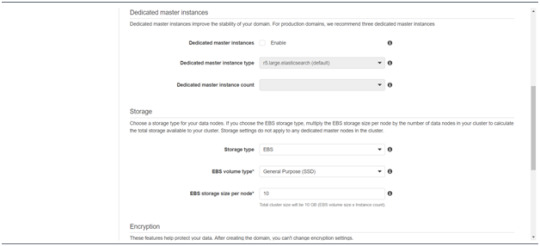
Follow to enter the “Dedicated master instances”
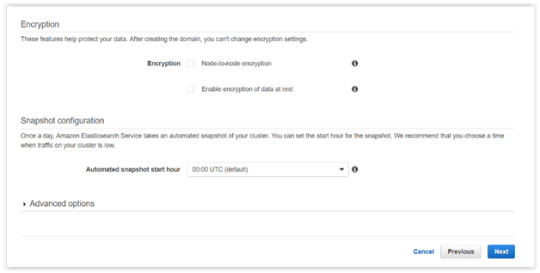
Click Next.
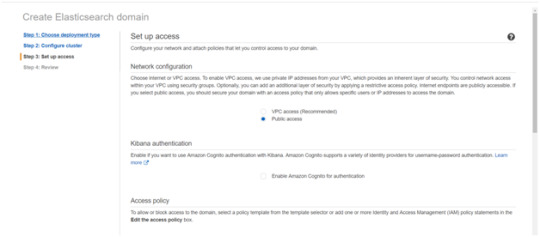
After the Cluster Configuration, you will be taken to the Set up access part. In the Setup access part, enable the specific set of users who can access your ElasticSearch cluster. There are two options — VPC access and Public access. Once you select one of the options and confirm your entries your new cluster is created.
Things to consider
1. Expandable
Amazon Elasticsearch Service provides to monitor your cluster through Amazon CloudWatch metrics.
We can change the cluster in various size from top or bottom within single clicks in the AWS management console or via a single API call.
There is a customizable setting available based on the range of instance types and storage options including SSD-powered EBS volumes.
2.Integrations
Many integrations available in the AWS Elasticsearch such as Kibana for data visualization, Amazon CloudTrail is used to audit API calls configure in AWS ES domains and integrate with Amazon Amazon S3, Amazon Kinesis, and Amazon DynamoDB for loading streaming data into Amazon ES.
3.Guarantee
It guarantees to provide a secure environment and easy integration with Amazon VPC and VPC security groups. There is an availability to access the Identity and Access Management (IAM) control. It provides authentication for Kibana and Data encryption with node-to-node encryption.
4.Availability
Amazon ES supports the different zones in two geographical locations and various node allocations with a large number of zones in the same region itself. It manages the cluster and notifies the damaged nodes automatically.
Conclusion
This article has covered what AWS Elastic Search means, its benefits, what happens between and how you can use it.
#AWS#Elasticsearch#LogAnalytics#SearchEngine#CloudComputing#DataVisualization#Kibana#Scalability#Security#CloudWatch#AWSIntegration#DataEncryption#VPC#ElasticCluster#API#CloudInfrastructure#TechSolutions#BigData#AWSElasticsearch#ElasticSearchService#DataAnalysis#CloudServices
0 notes
Text
What are the questions asked in DevOps interview for bigginers?
In the competitive IT industry, DevOps is becoming increasingly popular, and aspiring professionals are often asked a variety of questions in interviews. This guide provides you with the top 20 beginner DevOps interview questions, along with detailed explanations to help you prepare confidently.
1. What is DevOps?
Explanation: DevOps is a set of practices that combines software development (Dev) and IT operations (Ops). It aims to shorten the development lifecycle while delivering features, fixes, and updates frequently in alignment with business objectives.
2. What are the key components of DevOps?
Explanation: The key components of DevOps include continuous integration, continuous delivery (CI/CD), automation, infrastructure as code (IaC), monitoring, and collaboration between teams.
3. Explain Continuous Integration (CI).
Explanation: CI is a DevOps practice where developers frequently merge their code changes into a central repository, followed by automated builds and tests. This helps catch bugs early and speeds up the development process.
4. What is Continuous Delivery (CD)?
Explanation: CD ensures that code changes are automatically prepared for a release to production. It builds upon CI and automates the delivery of new updates, ensuring they are ready for production after passing through various test stages.
5. What are some common DevOps tools?
Explanation: Some popular DevOps tools include:
Jenkins for CI/CD automation
Docker for containerization
Kubernetes for container orchestration
Ansible for automation and configuration management
Git for version control
6. What is Infrastructure as Code (IaC)?
Explanation: IaC is a key DevOps practice where infrastructure is defined and managed using code, rather than through manual processes. Tools like Terraform and AWS CloudFormation are often used to automate infrastructure provisioning and management.
7. What is the role of version control in DevOps?
Explanation: Version control, using tools like Git, enables multiple developers to work on a project simultaneously. It keeps track of changes and maintains a history of revisions, ensuring that changes are coordinated and easily reversible.
8. What is Docker, and how does it fit into DevOps?
Explanation: Docker is a containerization tool that allows developers to package applications and their dependencies into a container, ensuring they run consistently across different environments. Docker simplifies deployment and scalability in DevOps workflows.
9. Explain the concept of container orchestration with Kubernetes.
Explanation: Kubernetes is an orchestration platform for managing, scaling, and deploying containerized applications. It automates the distribution of containers across a cluster of machines and handles load balancing, service discovery, and more.
10. What is a microservices architecture?
Explanation: Microservices architecture is an approach where applications are built as a collection of small, independent services. Each service can be developed, deployed, and scaled individually, making the system more resilient and flexible.
11. How do monitoring and logging fit into a DevOps pipeline?
Explanation: Monitoring and logging are crucial for identifying issues in production. Tools like Prometheus, Grafana, and ELK (Elasticsearch, Logstash, and Kibana) are often used to ensure system health, track performance, and troubleshoot problems.
12. What is the difference between Agile and DevOps?
Explanation: Agile is a software development methodology focused on iterative development and collaboration between teams. DevOps extends Agile principles by integrating development and operations, emphasizing automation, continuous feedback, and faster delivery.
13. What is a build pipeline?
Explanation: A build pipeline is a series of steps performed in sequence to automate the creation, testing, and deployment of code. It includes stages like source control, build, test, and deployment, ensuring that every change is properly validated before reaching production.
14. How do you manage configuration in DevOps?
Explanation: Configuration management involves maintaining consistency of systems and software over time. Tools like Ansible, Puppet, and Chef automate the process of configuring servers, ensuring that environments remain consistent across the development lifecycle.
15. What are the benefits of using Jenkins in DevOps?
Explanation: Jenkins is an open-source automation server that facilitates CI/CD processes. Its benefits include:
Easy integration with various DevOps tools
A large library of plugins
Flexibility to automate different tasks
A robust community for support
16. What is GitOps?
Explanation: GitOps is a DevOps practice where Git is the single source of truth for the system’s desired state. It uses Git pull requests to manage and deploy changes to applications and infrastructure, ensuring that changes are trackable and auditable.
17. What is the importance of automation in DevOps?
Explanation: Automation is crucial in DevOps because it reduces human intervention, minimizes errors, speeds up processes, and ensures consistency across deployments. This includes automating CI/CD, testing, infrastructure provisioning, and monitoring.
18. What is a rolling deployment?
Explanation: Rolling deployment is a technique where new versions of an application are gradually deployed to instances, replacing old ones. This ensures zero downtime by keeping part of the application available while the update is being deployed.
19. Explain the role of cloud platforms in DevOps.
Explanation: Cloud platforms, such as AWS, Azure, and Google Cloud, provide scalable and flexible infrastructure that aligns well with DevOps practices. They enable teams to provision resources on demand and integrate with automation tools to streamline deployments.
20. What is the significance of feedback loops in DevOps?
Explanation: Feedback loops ensure that teams get timely information about the performance and issues of their systems. Continuous feedback from users, automated monitoring, and testing tools help to detect problems early and ensure quick iterations.
Accelerate Your DevOps Career with Naresh IT’s DevOps Online Training
DevOps is essential for modern software development, and learning the skills needed to excel in DevOps is critical for your career. At Naresh IT, we offer comprehensive DevOps Online Training to equip you with in-demand skills like CI/CD, Docker, Kubernetes, cloud platforms, and more.
Whether you’re a beginner or looking to upskill, Naresh IT provides tailored content, hands-on labs, and real-world project experience to make you industry-ready.
Join Naresh IT’s DevOps Online Training today and kickstart your DevOps journey!
0 notes
Text
Sửa lỗi “secure Elasticsearch’ và giới hạn tài nguyên trên Graylog

Khi quản lý log với Graylog, bạn có thể gặp phải lỗi "secure Elasticsearch" và vấn đề giới hạn tài nguyên, ảnh hưởng đến hiệu suất và độ tin cậy của hệ thống. Việc khắc phục những vấn đề này là rất quan trọng để đảm bảo Graylog và Elasticsearch hoạt động ổn định và hiệu quả. Trong bài viết này, chúng tôi sẽ hướng dẫn bạn cách sửa lỗi "secure Elasticsearch" và thiết lập giới hạn tài nguyên trên Graylog. Hãy cùng SunCloud bọn mình tìm hiểu trong bài viết này nhé.
1. Sửa lỗi cảnh báo “secure Elasticsearch”
Khi tôi cài đặt Graylog 5.2 và elasticsearch 7.17 thi có gặp một lỗi elasticsearch gửi cảnh báo liên tục về Graylog rằng xác thực của Elasticsearch chưa có. Việc này ảnh hưởng đáng kể đến hiệu suất của m��y (tốn khá nhiều ram).
Message tôi nhận được liên tục ở file "/var/log/Graylog-server/server.log"
[RestClient] request [POST http://127.0.0.1:9200/_bulk?timeout=1m] returned 1 warnings: [299 Elasticsearch-7.17.21-d38e4b028f4a9784bb74de339ac1b877e2dbea6f "Elasticsearch built-in security features are not enabled. Without authentication, your cluster could be accessible to anyone. See https://www.elastic.co/guide/en/elasticsearch/reference/7.17/security-minimal-setup.html to enable security."]
Để giảm bớt cảnh báo của lỗi này ta chỉ cần chỉnh sửa file “/etc/elasticsearch/elasticsearch.yml” và thêm vào cuối dòng “http.max_warning_header_count: 0” là có thể khắc phục được lỗi đó. Tiếp theo tôi sẽ hướng dẫn bạn cách cấu hình user và password cho Elasticsearch.
1.1 Tạo User và password cho Elasticsearch
sửa file cấu hình elasticsearch
vi /etc/elasticsearch/elasticsearch.yml
Thêm nội dung sau vào cuối file
xpack.security.enabled: true
http.max_warning_header_count: 0
Restart lại dịch vụ
systemctl restart elasticsearch.service
Di chuyển đến thư mục
cd /usr/share/elasticsearch/
Đặt password với lệnh
./bin/elasticsearch-setup-passwords interactive
1.2 Sửa lại cấu hình Graylog
Tiếp theo trên file cấu hình của Graylog ta cũng cần sửa lại.
vi /etc/Graylog/server/server.conf
Thêm vào dòng này để khai báo thông tin đăng nhập elasticsearch.
elasticsearch_hosts = http://elastic:[email protected]:9200
Bây giờ ta tiến hành restart lại dịch vụ là xong.
systemctl restart Graylog-server.service
2. Giới hạn tài nguyên trên Graylog và Elasticsearch
Trên Graylog và Elasticsearch có hỗ trợ chúng ta giới hạn tài nguyên phần cứng của máy ảo mà chúng có thể sử dụng như được phép sử dụng bao nhiêu RAM, CPU hay Disk như nào.
2.1 Giới hạn tài nguyên trên Elasticsearch
Xms : Lượng ram mà Elasticsearch sử dụng ngay khi khởi động.
Xmx : kích thước ram tối đa Elasticsearch được sử dụng Để cấu hình được 2 tham số này thì ta sẽ sửa trên file "/etc/elasticsearch/jvm.options".
Bây giờ ta tiến hành restart lại dịch vụ là xong.
systemctl restart Graylog-server.service
2.2 Giới hạn tài nguyên trên Graylog
Graylog cũng có tham số Xms và Xmx nhưng nó được đặt trong file "/etc/default/Graylog-server".
Ngoài ra còn có các tham số khác liên quan đến sử dụng tài nguyên ở trong file "/etc/Graylog/server/server.conf".
processbuffer_processors : Chỉ định số lượng bộ xử lý được sử dụng cho buffer xử lý.
outputbuffer_processors :Chỉ định số lượng bộ xử lý được sử dụng cho buffer đầu ra (elasticsearch).
processor_wait_strategy: Xác định trạng thái của bộ xử lý khi ở chế độ chờ. yielding, sleeping, blocking, busy_spinning.
ring_size: Xác định kích thước của ring buffer, ring_size = 65536 nghĩa là ring buffer có thể chứa tối đa 65,536 tin nhắn cùng một lúc.
message_journal_enabled : Message journal là một tính năng của Graylog giúp lưu trữ các tin nhắn tạm thời trên đĩa cứng trước khi chúng được xử lý và gửi đi. Việc này tránh mất dữ liệu khi khởi động lại Graylog. Kích thước tối đa mặc định là 5g.
Lời kết
Việc sửa lỗi “secure Elasticsearch” và giới hạn tài nguyên trên Graylog không chỉ giúp cải thiện hiệu suất hệ thống mà còn đảm bảo sự ổn định và bảo mật cho dữ liệu log của bạn. Bằng cách thực hiện các bước hướng dẫn trên, bạn có thể tối ưu hóa cấu hình Graylog và Elasticsearch, từ đó nâng cao khả năng quản lý và phân tích log. Hãy duy trì việc kiểm tra và tối ưu hệ thống thường xuyên để đảm bảo rằng Graylog hoạt động một cách hiệu quả nhất, đáp ứng tốt các yêu cầu giám sát và bảo mật của bạn. Chúc bạn thành công!
Nguồn: https://suncloud.vn/secure-elasticsearch
0 notes
Text
Kubernetes Security Best Practices: Safeguarding Your Containerized Applications

Kubernetes has revolutionized the way we deploy, manage, and scale containerized applications. However, with its growing adoption comes the critical need to ensure robust security practices to protect your infrastructure and data. Here are some essential Kubernetes security best practices to help you safeguard your containerized applications.
1. Network Policies
Implementing network policies is crucial for controlling traffic between pods. Kubernetes network policies allow you to define rules for inbound and outbound traffic at the pod level. By default, Kubernetes allows all traffic between pods, which can be a security risk. Use network policies to create a zero-trust network, where only explicitly permitted traffic is allowed.
2. Role-Based Access Control (RBAC)
RBAC is vital for managing who can access and perform actions within your Kubernetes cluster. Assign roles based on the principle of least privilege, ensuring that users and service accounts only have the permissions they need to perform their tasks. Regularly review and audit RBAC policies to maintain tight security.
3. Pod Security Policies
Pod Security Policies (PSPs) help enforce security standards at the pod level. PSPs can control aspects such as whether privileged containers can run, what volume types can be used, and which users can run containers. Although PSPs are being deprecated in future Kubernetes releases, consider using alternative tools like Open Policy Agent (OPA) or Kubernetes Pod Security Standards (PSS).
4. Image Security
Ensuring the security of container images is paramount. Use trusted sources for your base images and regularly update them to include security patches. Implement image scanning tools to detect vulnerabilities and misconfigurations in your images before deploying them. Tools like Clair, Trivy, and Aqua Security can help automate this process.
5. Secrets Management
Kubernetes Secrets are used to store sensitive information, such as passwords and API keys. However, storing secrets directly in environment variables or configuration files can expose them to potential attackers. Use Kubernetes Secrets to manage sensitive data and consider integrating with external secrets management solutions like HashiCorp Vault or AWS Secrets Manager for enhanced security.
6. Audit Logging
Enable and configure audit logging to track and monitor activities within your Kubernetes cluster. Audit logs provide valuable insights into who did what, when, and where, which is essential for detecting and responding to security incidents. Use tools like Fluentd, Elasticsearch, and Kibana to aggregate and analyze audit logs.
7. Cluster Hardening
Hardening your Kubernetes cluster involves securing the underlying infrastructure and configurations. Ensure your Kubernetes components, such as the API server, kubelet, and etcd, are securely configured. Disable insecure features, enforce HTTPS, and restrict access to the API server. Regularly update your Kubernetes components to the latest stable versions to incorporate security patches and improvements.
8. Resource Quotas and Limits
Set resource quotas and limits to prevent resource abuse and Denial-of-Service (DoS) attacks. By defining limits on CPU, memory, and other resources, you can ensure that no single pod or user consumes excessive resources, potentially impacting the stability and security of your cluster.
9. Namespace Segmentation
Segment your Kubernetes cluster using namespaces to isolate different applications or teams. Namespaces provide logical separation within a cluster, allowing you to apply security policies and resource quotas at a granular level. This helps contain potential security breaches and limits the blast radius of an attack.
10. Regular Security Audits and Penetration Testing
Conduct regular security audits and penetration testing to identify and address vulnerabilities in your Kubernetes cluster. Automated security scanning tools can help, but manual audits and penetration testing by skilled security professionals provide an additional layer of assurance. Regular assessments help you stay ahead of emerging threats and maintain a robust security posture.
Conclusion
Securing your Kubernetes environment is an ongoing process that requires vigilance, regular updates, and adherence to best practices. By implementing these Kubernetes security best practices, you can significantly reduce the risk of security breaches and ensure the safety of your containerized applications. Stay informed about the latest security trends and continuously improve your security measures to protect your infrastructure and data.
0 notes
Text
Performance Optimization on OpenShift
Optimizing the performance of applications running on OpenShift involves several best practices and tools. Here's a detailed guide:
1. Resource Allocation and Management
a. Proper Sizing of Pods and Containers:
- Requests and Limits:Set appropriate CPU and memory requests and limits to ensure fair resource allocation and avoid overcommitting resources.
- Requests: Guaranteed resources for a pod.
- Limits:Maximum resources a pod can use.
- Vertical Pod Autoscaler (VPA):Automatically adjusts the CPU and memory requests and limits for containers based on usage.
b. Resource Quotas and Limits:
- Use resource quotas to limit the resource usage per namespace to prevent any single application from monopolizing cluster resources.
c. Node Selector and Taints/Tolerations:
- Use node selectors and taints/tolerations to control pod placement on nodes with appropriate resources.
2. Scaling Strategies
a. Horizontal Pod Autoscaler (HPA):
- Automatically scales the number of pod replicas based on observed CPU/memory usage or custom metrics.
- Example Configuration:
```yaml
apiVersion: autoscaling/v1
kind: HorizontalPodAutoscaler
metadata:
name: my-app-hpa
spec:
scaleTargetRef:
apiVersion: apps/v1
kind: Deployment
name: my-app
minReplicas: 2
maxReplicas: 10
targetCPUUtilizationPercentage: 70
```
b. Cluster Autoscaler:
- Automatically adjusts the size of the OpenShift cluster by adding or removing nodes based on the workload requirements.
3. Application and Cluster Tuning
a. Optimize Application Code:
- Profile and optimize the application code to reduce resource consumption and improve performance.
- Use tools like JProfiler, VisualVM, or built-in profiling tools in your IDE.
b. Database Optimization:
- Optimize database queries and indexing.
- Use connection pooling and proper caching strategies.
c. Network Optimization:
- Use service meshes (like Istio) to manage and optimize service-to-service communication.
- Enable HTTP/2 or gRPC for efficient communication.
4. Monitoring and Analyzing Performance
a. Prometheus and Grafana:
- Use Prometheus for monitoring and alerting on various metrics.
- Visualize metrics in Grafana dashboards.
- Example Prometheus Configuration:
```yaml
apiVersion: monitoring.coreos.com/v1
kind: ServiceMonitor
metadata:
name: my-app
spec:
selector:
matchLabels:
app: my-app
endpoints:
- port: web
interval: 30s
```
b. OpenShift Monitoring Stack:
- Leverage OpenShift's built-in monitoring stack, including Prometheus, Grafana, and Alertmanager, to monitor cluster and application performance.
c. Logging with EFK/ELK Stack:
- Use Elasticsearch, Fluentd, and Kibana (EFK) or Elasticsearch, Logstash, and Kibana (ELK) stack for centralized logging and log analysis.
- Example Fluentd Configuration:
```yaml
apiVersion: v1
kind: ConfigMap
metadata:
name: fluentd-config
data:
fluent.conf: |
<source>
@type tail
path /var/log/containers/*.log
pos_file /var/log/fluentd-containers.log.pos
tag kubernetes.*
format json
time_format %Y-%m-%dT%H:%M:%S.%NZ
</source>
```
d. APM Tools (Application Performance Monitoring):
- Use tools like New Relic, Dynatrace, or Jaeger for distributed tracing and APM to monitor application performance and pinpoint bottlenecks.
5. Best Practices for OpenShift Performance Optimization
a. Regular Health Checks:
- Configure liveness and readiness probes to ensure pods are healthy and ready to serve traffic.
- Example Liveness Probe:
```yaml
livenessProbe:
httpGet:
path: /healthz
port: 8080
initialDelaySeconds: 30
periodSeconds: 10
```
b. Efficient Image Management:
- Use optimized and minimal base images to reduce container size and startup time.
- Regularly scan and update images to ensure they are secure and performant.
c. Persistent Storage Optimization:
- Use appropriate storage classes for different types of workloads (e.g., SSD for high I/O applications).
- Optimize database storage configurations and perform regular maintenance.
d. Network Policies:
- Implement network policies to control and secure traffic flow between pods, reducing unnecessary network overhead.
Conclusion
Optimizing performance on OpenShift involves a combination of proper resource management, scaling strategies, application tuning, and continuous monitoring. By implementing these best practices and utilizing the available tools, you can ensure that your applications run efficiently and effectively on the OpenShift platform.
For more details click www.hawkstack.com
#redhatcourses#information technology#linux#containerorchestration#docker#kubernetes#container#containersecurity#dockerswarm#aws
0 notes
Text
🚀 Enterprise Kubernetes Storage with Red Hat OpenShift Data Foundation
As enterprises continue to adopt Kubernetes for container orchestration, the demand for scalable, resilient, and enterprise-grade storage solutions has never been higher. While Kubernetes excels in managing stateless applications, managing stateful workloads—such as databases, messaging queues, and AI/ML pipelines—poses unique challenges. This is where Red Hat OpenShift Data Foundation (ODF) steps in as a game-changer.
📦 What is Red Hat OpenShift Data Foundation?
Red Hat OpenShift Data Foundation (formerly OpenShift Container Storage) is a software-defined storage solution designed specifically for OpenShift environments. Built on Ceph and NooBaa, ODF provides a unified storage layer that seamlessly supports block, file, and object storage within your Kubernetes infrastructure.
ODF delivers highly available, scalable, and secure storage for cloud-native workloads, empowering DevOps teams to run stateful applications confidently across hybrid and multi-cloud environments.
🔧 Key Features of OpenShift Data Foundation
1. Unified Storage for Kubernetes
ODF supports:
Block Storage for databases and persistent workloads
File Storage for legacy applications and shared volumes
Object Storage for cloud-native applications, backup, and AI/ML data lakes
2. Multi-Cloud & Hybrid Cloud Ready
Deploy ODF on bare metal, private clouds, public clouds, or hybrid environments. With integrated NooBaa technology, it allows seamless object storage across AWS S3, Azure Blob, and on-premises storage.
3. Integrated with OpenShift
ODF is tightly integrated with Red Hat OpenShift, allowing:
Native support for Persistent Volume Claims (PVCs)
Automated provisioning and scaling
Built-in monitoring through OpenShift Console and Prometheus/Grafana
4. Data Resilience & High Availability
Through Ceph under the hood, ODF offers:
Data replication across nodes
Self-healing storage clusters
Built-in erasure coding for space-efficient redundancy
5. Security & Compliance
ODF supports:
Encryption at rest and in transit
Role-Based Access Control (RBAC)
Integration with enterprise security policies and key management services (KMS)
🧩 Common Use Cases
Database as a Service (DBaaS) on Kubernetes
CI/CD Pipelines with persistent cache
AI/ML Workloads requiring massive unstructured data
Kafka, Elasticsearch, and other stateful operators
Backup & Disaster Recovery for OpenShift clusters
🛠️ Architecture Overview
At a high level, ODF deploys the following components:
ODF Operator: Automates lifecycle and management
CephCluster: Manages block and file storage
NooBaa Operator: Manages object storage abstraction
Multicloud Object Gateway (MCG): Bridges cloud and on-prem storage
The ODF stack ensures zero downtime for workloads and automated healing in the event of hardware failure or node loss.
🚀 Getting Started
To deploy OpenShift Data Foundation:
Install OpenShift on your preferred infrastructure.
Enable the ODF Operator from OperatorHub.
Configure storage cluster using local devices, AWS EBS, or any supported backend.
Create storage classes for your apps to consume via PVCs.
Pro Tip: Use OpenShift’s integrated dashboard to visualize storage usage, health, and performance metrics out of the box.
🧠 Final Thoughts
Red Hat OpenShift Data Foundation is more than just a storage solution—it's a Kubernetes-native data platform that gives you flexibility, resilience, and performance at scale. Whether you're building mission-critical microservices or deploying petabyte-scale AI workloads, ODF is designed to handle your stateful needs in an enterprise-ready way.
Embrace the future of cloud-native storage with Red Hat OpenShift Data Foundation.For more details www.hawkstack.com
0 notes